
Provenance, Error, and Uncertainty in GIScience
Thoughts from Longley et al. (2008)
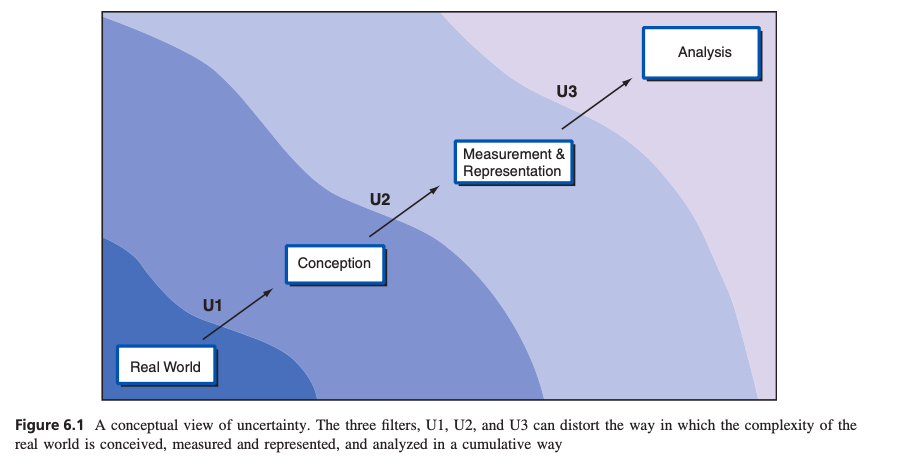
Longley et al’s conceptual view of uncertainty (Figure 6.1) shows how uncertainty will compound during each step in the process of analyzing real world phenomena. I believe Filter U1 (conceptionalization of the real world) has the most capacity for uncertainty yet is the hardest step to reduce uncertainty in, whereas uncertainty can most easily be reduced in Filter U3 (analyzing data) but will always exist in that step due to the prior steps in the process. Despite the vast potential uncertainty in U1, I think the multitude of ways people conceptualize the real world is what leads to the expansion of knowledge. This is the step in the scientific process where people’s different perspectives on the same phenomena can be explored and lead to new findings. In theory, the “best” study will have minimized uncertainty in all of the filters, but I don’t think it’s wise to try to eliminate all uncertainty within this filter.
How, then, do geographers embrace this nuanced uncertainty while producing statistically significant results? Acknowledging the uncertainty, by expounding on methods and rationale, in report or metadata, is an important way to not be misleading.
In the context of Malcomb et al. (2014)
Longley et al. (2008) brings up the point that there are no “natural units” in geographic analysis, and I think this is one key reason why geography is considered a social science as opposed to a physical or “hard” science. Malcomb (2014) is a perfect example of how the measurements in spatial analysis are susceptible to uncertainty. The interviews forming the basis of the weights assigned to contributers to vulnerability are very subjective and not an absolute or “natural” unit that could be measured. Despite the lack of a natural unit system, standards across data could be a way to minimize these differences in measurement. This still is not straightforward: in the context of Malcomb (2014), this would require standards around calculating risk indices, but the factors and weights used are totally depending on location and specific data representation goals.
Uncertainty in the Malcomb (2014) study compounds in the manner shown in Figure 6.1 and is present in the conception, interviews, and adaptive capacity calculation such that by the time you get to the final vulnerability map, it’s hard to know how confident one can be in the results. This is exemplified in the comparison of the original map and the reproduced map—the reproduced vulnerability scores can be extremely different and vary from the original study in a seemingly random way across the map.
First-hand experience
This summer, I measured sediment erosion using photogrammetry-derived point clouds and compared erosion over the course of several years. My supervisor wanted as high resolution as possible, so I collected data using a camera on a tripod (as opposed to the larger resolution available LiDAR data that wouldn’t pick up changes under 1m.) The camera captured stones on the centimeter scale so the models had really high resolution. However, by moving the tripod around on sandbars and arroyos to collect the imagery, I was personally causing erosion that was captured in the images. When comparing data between years, there was no GPS or local coordinate system tied to the data so I was manually aligning the images. Despite the findings that emerged, I recognized that there were a lot of sources of uncertainty. When trying to quantify the accuracy of my findings, I struggled; between meausurement methods, data processing, and analysis, I concluded that I could really only confidently use the data to identify general areas of erosion and not actual quantities…which was the whole goal of the project.
References
Longley, P. A., M. F. Goodchild, D. J. Maguire, and D. W. Rhind. 2008. Geographical information systems and science 2nd ed. Chichester: Wiley. Chapter 6: Uncertainty, (pages 127-153).
Malcomb, D. W., E. A. Weaver, and A. R. Krakowka. 2014. Vulnerability modeling for sub-Saharan Africa: An operationalized approach in Malawi. Applied Geography 48:17–30. DOI:10.1016/j.apgeog.2014.01.004